
 Available in US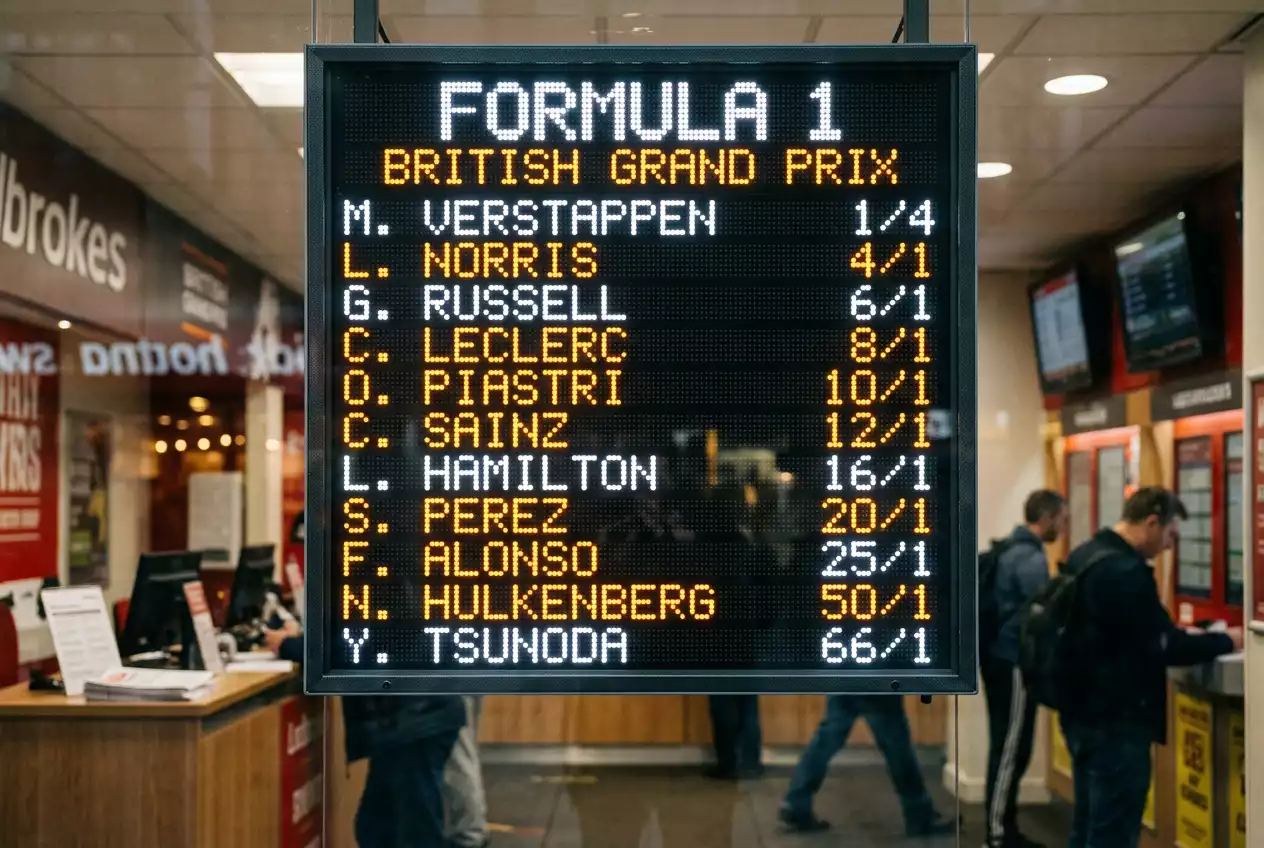
- What F1 Odds Actually Tell You — and What They Hide
- Fractional Odds: The UK Standard
- Decimal Odds: The European Format
- Converting Between Formats (with Worked Examples)
- Implied Probability and Bookmaker Overround
- Comparing Odds Across Bookmakers for F1
- How Championship Outright Odds Move Through a Season
- Frequently Asked Questions
What F1 Odds Actually Tell You — and What They Hide
I spent my first full season betting on F1 without understanding overround. I thought odds were a direct reflection of probability — that if a bookmaker priced a driver at 4/1, there was roughly a 20% chance they would win. It took a year of meticulous record-keeping and a quietly devastating loss column to realise that every price I was reading contained a hidden tax, and that tax was the reason I was losing money on bets that should have been breaking even.
F1 odds look straightforward. A number next to a name, a potential payout. But those numbers carry embedded information about probability, market depth, bookmaker margin and competitive dynamics that most punters never extract. If you are betting on a sport that constitutes just 0.4% of the global betting handle, you are already operating in a thinner market than football or horse racing. Thinner markets mean wider margins, less liquidity and — crucially — more opportunities for anyone who can read the prices properly.
Jonny Haworth, F1’s Director of Commercial Partnerships, has described this disparity bluntly: a sport the size of Formula One, with low-latency data at high volume, generating less than half a percent of global wagering is remarkable. What that means for you as a bettor is that F1 odds are priced with less competitive pressure than Premier League football. The margins are wider, the prices are stickier, and the informed bettor has room to operate.
This guide will teach you to read F1 odds in both major UK formats, convert between them, extract implied probability, identify the bookmaker’s margin and compare prices across platforms. By the end, you will look at a column of race-winner odds and see not just numbers but a map of where the market thinks the race is going — and where it might be wrong.
Fractional Odds: The UK Standard
Walk into any bookmaker on a British high street and the odds are fractional. It is the format most UK punters grew up with, and it remains the default display on the majority of domestic sportsbooks. Understanding fractional odds is non-negotiable if you are betting on F1 in this country — roughly 8% of UK adults place online sports bets in any given month, and the vast majority of them encounter fractional prices first.
A fractional odd is written as two numbers separated by a slash: 5/1, 7/2, 11/4. The number on the left is the profit you stand to make. The number on the right is the stake required to generate that profit. At 5/1, a one-pound stake returns five pounds of profit plus your original pound back — six pounds total. At 7/2, a two-pound stake returns seven pounds of profit plus your two-pound stake — nine pounds total.
The intuition behind fractional odds is ratio-based. Think of 5/1 as “for every one unit you risk, you gain five.” The higher the first number relative to the second, the less likely the bookmaker considers that outcome. A race favourite might be priced at 6/4 — a relatively tight ratio implying the bookmaker thinks it is a probable outcome. A long shot might be 33/1 — a wide ratio implying low probability but high reward.
Odds-on prices
When the number on the right is larger than the number on the left — 4/6, 1/3, 2/7 — the price is “odds on.” This means the bookmaker considers the outcome more likely than not. At 1/3, you need to stake three pounds to win one pound of profit. Odds-on prices appear regularly in F1 for dominant drivers during strong seasons. When a championship leader arrives at a circuit that suits their car, you will often see race-winner odds of 4/6 or shorter.
The trap for new F1 bettors is assuming odds-on prices are safe. They are not. A driver priced at 1/2 has an implied probability of around 67%, which means they lose roughly one in three times. Staking large amounts at odds-on in the hope of small guaranteed returns is the fastest way to erode a bankroll when the “unlikely” outcome eventually arrives — and in F1, with safety cars, weather and mechanical failures, it arrives more often than the price suggests.
Common fractional odds in F1 markets
Race-winner markets for a competitive season typically range from 6/4 for the favourite down to 200/1 or longer for backmarkers. Podium-finish markets compress this range — a midfield driver might be 3/1 for a podium but 20/1 for the win. Head-to-head markets between teammates often produce tight prices like 4/5 and evens, reflecting near-equal ability. Each market type has its own characteristic odds range, and learning those ranges helps you spot when a price is unusually generous or unusually tight.
Decimal Odds: The European Format
The first time I used a European sportsbook, I nearly placed a bet at what I thought were terrible odds before realising the entire pricing system was different. Decimal odds include your stake in the total return, which makes them mathematically cleaner but initially confusing for anyone raised on fractional pricing.
A decimal odd is a single number: 2.50, 4.00, 12.00. Multiply your stake by this number to get your total return — stake included. A ten-pound bet at 2.50 returns twenty-five pounds total, of which fifteen is profit and ten is your original stake. A ten-pound bet at 4.00 returns forty pounds total.
The elegance of decimal odds is that they map directly to implied probability. Divide one by the decimal price and you have the bookmaker’s implied probability. At 2.50, the implied probability is 1 / 2.50 = 0.40, or 40%. At 4.00, it is 25%. At 12.00, it is 8.3%. No intermediate calculation, no splitting numerators and denominators. Just one division.
This directness is why I switched to decimal odds for all my analytical work about six years ago, even though I still read fractional prices on UK platforms by habit. When you are comparing a driver across four bookmakers and trying to identify which offers the best value, decimal odds let you see the probability gap instantly. At fractional odds of 7/2, 4/1 and 9/2, the comparison requires mental arithmetic. At decimal odds of 4.50, 5.00 and 5.50, the hierarchy is obvious.
The “always above 1.00” rule
Decimal odds are always at least 1.00, because that represents the return of your stake alone with zero profit. In practice, the lowest decimal odds you will see in F1 are around 1.20 to 1.30 for overwhelming favourites — rare, but it happens when a dominant driver is expected to win a specific race with near-certainty. The equivalent fractional odds of 1/5 or 3/10 look more dramatic, but the decimal number tells you exactly what you are getting: 1.20 means a twenty-pence return for every pound staked.
When to use which format
Use whatever your platform defaults to for placing bets — there is no advantage in switching the display if it slows down your decision-making during live markets. But for analysis, comparison and model-building, decimal is superior. Every serious bettor I know does their spreadsheet work in decimal regardless of which format they read on screen. The conversion is simple enough that you can toggle between formats mentally once you have practised, and I will walk through that conversion next.
Converting Between Formats (with Worked Examples)
I keep a conversion cheat sheet taped to my monitor — not because the maths is hard, but because speed matters when you are scanning multiple platforms for the best price during a qualifying session. After enough repetitions, the common conversions become automatic. Until then, here are the formulas and some worked examples.
Fractional to decimal
Divide the numerator by the denominator and add one. That is it. 5/1 becomes (5 / 1) + 1 = 6.00. 7/2 becomes (7 / 2) + 1 = 4.50. 11/4 becomes (11 / 4) + 1 = 3.75. The “+1” accounts for the fact that decimal odds include your returned stake while fractional odds show only profit.
For odds-on fractional prices, the same formula applies. 4/6 becomes (4 / 6) + 1 = 1.67. 1/3 becomes (1 / 3) + 1 = 1.33. The resulting decimal number will always be between 1.00 and 2.00 for odds-on prices.
Decimal to fractional
Subtract one from the decimal odds, then express the result as a fraction in its simplest form. 4.50 becomes 4.50 – 1 = 3.50, which is 7/2. 3.00 becomes 3.00 – 1 = 2.00, which is 2/1. 1.80 becomes 1.80 – 1 = 0.80, which is 4/5.
The tricky part is simplifying. A decimal of 3.75 gives you 2.75, which as a fraction is 275/100, simplified to 11/4. A decimal of 2.88 gives you 1.88, or 188/100, simplified to 47/25 — which is why some European odds look awkward in fractional form. UK bookmakers round to standard fractions (11/8, 13/8, 15/8 and so on), so the conversion is not always exact. For analysis purposes, I work in decimal and only convert back to fractional when confirming a bet on a UK platform.
A full worked example: race-winner market
Suppose three drivers are priced as follows in fractional odds: Driver A at 6/4, Driver B at 3/1 and Driver C at 8/1. Converting to decimal: Driver A is 2.50, Driver B is 4.00 and Driver C is 9.00. The implied probabilities are 40%, 25% and 11.1% respectively. These three alone sum to 76.1% — well short of 100% — because the market includes many more drivers. The full field’s implied probabilities will sum to something above 100%, and that excess is the bookmaker’s margin. I will explain exactly how to identify and account for that margin in the next section.
Implied Probability and Bookmaker Overround
This is the section that changed how I bet. Before I understood overround, I was comparing my gut feeling against the bookmaker’s odds and wondering why I kept losing on bets that “should have been close.” After I understood it, I stopped wondering.
Implied probability is the chance of an outcome as embedded in the odds. At decimal 4.00, the implied probability is 25%. But here is the catch: if you add up the implied probabilities of every outcome in a market — every driver in a race-winner market, for example — the total will not be 100%. It will be 110%, 115%, sometimes 125% or more. That excess over 100% is the overround, and it is how bookmakers guarantee a profit regardless of the result.
The UK remote betting sector generated 7.8 billion pounds in gross gambling yield in the year to March 2025. That revenue does not come from bookmakers being lucky. It comes from overround built into every market. Understanding this is not academic — it is the difference between betting blind and betting informed.
Calculating overround
Take a simplified three-driver market. Driver A at 2.50 (40%), Driver B at 4.00 (25%), Driver C at 5.00 (20%). The sum of implied probabilities is 85% — but this only covers three drivers. Add the rest of the field and you might reach 118%. The overround is 18%, meaning the bookmaker has an 18% built-in advantage across the market.
F1 race-winner markets tend to carry overrounds between 115% and 130%, which is significantly higher than football match markets (typically 103% to 108%). The reason is simple: a twenty-driver field with uncertain probabilities gives the bookmaker more room to inflate margins without any single price looking obviously wrong. If the overround on a football match winner is 105%, a sharp bettor can quickly identify which of three prices is inflated. If the overround on a twenty-driver F1 field is 120%, that inflation is spread thinly enough across twenty prices that it is harder to pinpoint.
Removing overround to get true probabilities
To compare the bookmaker’s view against your model, you need to strip out the margin. The simplest method is proportional: divide each driver’s implied probability by the total overround. If Driver A has a raw implied probability of 40% in a market with 120% total, the adjusted probability is 40% / 120% = 33.3%. This is an approximation — more sophisticated methods exist that account for how overround is distributed across favourites versus long shots — but it is accurate enough for most F1 betting decisions.
Once you have adjusted probabilities, you can compare them directly against your pre-race model. If your model says Driver A has a 38% chance and the adjusted market probability is 33%, that five-point gap suggests a potential value bet. If your model says 30% and the market says 33%, the market has already priced in more optimism than your data supports — pass. Applying this comparison across every F1 betting market available is what separates recreational punters from consistent performers.
Comparing Odds Across Bookmakers for F1
During the 2024 season, I tracked race-winner odds across five UK-licensed platforms for every grand prix. The price differences were staggering. For the same driver at the same race, the gap between the best and worst available odds was regularly 15% to 20% in implied probability terms. On a driver priced around 6/1 at the tightest bookmaker, I found 8/1 at the widest — a difference that, over a season of bets, amounts to hundreds of pounds in foregone returns.
Bet365 remains the most-used platform among motorsport bettors, with 41% of active motorsport punters reporting using it in a typical week. DraftKings and FanDuel follow at 32% and 30% respectively. But popularity does not equal best odds. Each platform’s F1 pricing is set by different trading teams with different models, and their competitive positions shift from race to race. The bookmaker offering the best price at Monaco might offer the worst at Monza.
Line shopping: the simplest edge
Line shopping — checking the same market across multiple bookmakers before placing a bet — is the single easiest way to improve your long-term returns. It requires no model, no analysis and no expertise beyond the ability to open three or four browser tabs. Yet most casual F1 bettors do not do it. They have one account, they bet on that account, and they accept whatever price is offered.
My workflow is to check at least three platforms for every bet. If the best price is significantly better than the others — more than 10% in decimal terms — I take it immediately, because F1 odds can move quickly in the hours before a race. If the prices are clustered within a few percent, I pick the platform based on secondary factors: cash-out availability, in-play market speed or simply which one has the largest existing balance.
Odds aggregators and their limits
Aggregator sites compile odds from multiple bookmakers into a single view, which saves the effort of checking each platform individually. They are useful as a starting point, but they have two limitations for F1. First, the odds shown are sometimes delayed by minutes — fine for pre-race markets that move slowly, but unreliable for in-play comparisons where prices change every lap. Second, aggregators do not always include every F1 market. They may show race-winner odds but miss podium finishes, head-to-heads or qualifying props, which is where some of the best value lives.
I use aggregators for a quick scan on Friday evening, then drill into individual platforms on Saturday and Sunday when the market is most active. The combination gives me breadth and accuracy without wasting time on platforms that are consistently uncompetitive for F1.
How Championship Outright Odds Move Through a Season
Championship outright odds are the longest bet in motorsport — placed as early as February and settled in December. Over those ten months, the odds tell a story of shifting confidence, mechanical drama and strategic pivots that mirrors the season itself. Reading that story in real time is one of the most intellectually rewarding parts of F1 betting, and it creates genuine trading opportunities that single-race markets cannot.
F1’s global fan base reached 827 million in 2025, growing 12% year on year, and that expanding audience means more casual money flows into championship outright markets at predictable moments: pre-season testing, after the opening race and following any dramatic championship-swing result. Each injection of casual money temporarily inflates the favourite and suppresses the challengers, creating windows where a contrarian bettor can find value.
Pre-season pricing
Outright odds first appear after the previous season ends and are adjusted through winter testing. Pre-season prices are the loosest of the year because uncertainty is at its maximum. Nobody knows how the new cars truly compare until the first qualifying session under competitive conditions. This uncertainty means the margins are widest — overrounds on pre-season outrights can exceed 140% — but it also means the range of plausible outcomes is broadest, which is where long-shot value lives.
I have found my best championship outright returns from bets placed before the first race on drivers whose teams had strong testing but were not yet reflected as serious contenders in the market. The market anchors heavily to the previous season’s standings, so a team that finished fifth but has made a genuine step forward in the regulations will often be overpriced in February.
Mid-season movement
After five or six races, the market’s view sharpens dramatically. Points gaps are real, upgrade trajectories are visible and the field has sorted itself into tiers. Championship odds compress: the leader shortens, the chasers adjust, and anyone who looked like a contender but has underperformed drifts out to long prices. Mid-season is not typically the best time to enter outright bets because the market has absorbed the most valuable information. But it is the best time to trade: if you backed a driver pre-season at 12/1 and they are now 3/1 after winning three of the first six races, you have unrealised value that you can lock in by laying them on an exchange or simply accepting the current market position.
Late-season dynamics
The final quarter of the season is where outright odds become almost binary. Either the leader has a commanding points advantage and is priced at 1/10 or shorter, or the championship is tight and the top two or three drivers are priced in a narrow band. Late-season value is rare for new bets but abundant for exits — deciding when to cash out a pre-season position is a skill in itself, and one that most outright bettors neglect. I use a simple heuristic: if the probability implied by the current outright odds exceeds my model’s probability by more than ten percentage points, I take the profit. Greed at 1/3 when you entered at 12/1 is a recipe for regret.
