
 Available in US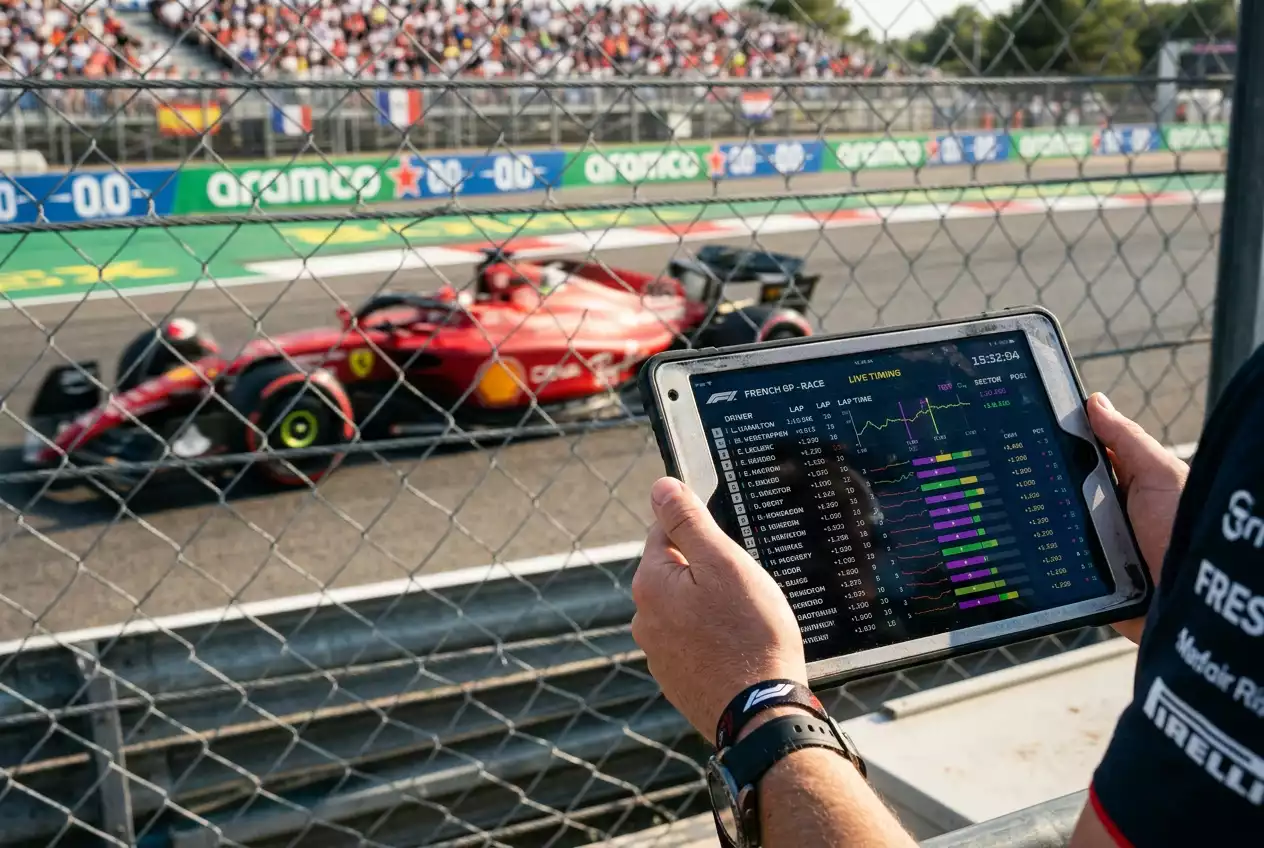
- Why Generic Tips Fail — and What Replaces Them
- Pre-Race Data Analysis: Practice, Qualifying and Long Runs
- Identifying Value: Implied Probability vs Your Model
- Race-Day Variables: Weather, Safety Cars and Grid Penalties
- Bankroll Management for F1 Bettors
- Three Strategy Mistakes and How to Fix Them
- Frequently Asked Questions
Why Generic Tips Fail — and What Replaces Them
Three seasons ago, I kept a spreadsheet of every F1 betting tip I found online during a single race weekend at Spa. Forty-seven tips across a dozen sites. Twenty-nine of them said the same thing: “check the weather forecast and recent form.” That is not a strategy. That is common sense dressed up in a subheading.
The reality is that most F1 betting advice stays deliberately vague because specificity demands effort — and effort scares off casual readers. But you are still here, so I will assume you want the version that actually works. The version built on timing sheets, degradation data and probability models rather than a quick glance at the championship standings.
Here is the uncomfortable truth about F1 betting in its current state: only 22% of fans who actively bet on sport have placed a wager on motorsport in the past twelve months. That is an astonishingly low conversion rate for a sport with 827 million global fans. The gap between interest and action exists partly because the betting product has been underdeveloped — F1 accounts for just 0.4% of the global betting handle — but it also exists because most punters do not know where to start with analysis. The generic tip industry fills that void with noise.
Mark Wrigley, F1’s Head of Betting, put it plainly when he described the challenge of building a betting product from scratch: bringing something to market where there has been no investment on the product front means there is enormous green field ahead. That green field is not just for the operators. It is for anyone willing to do the analytical work that the market has not yet priced in efficiently.
What replaces generic tips is a structured, data-first approach to race weekends. Over nine years of betting on F1, I have refined this into a repeatable process that I will walk you through in this guide. It is not a guarantee of profit — nothing in betting is — but it is a framework that turns gut feeling into informed decisions backed by numbers. The process starts seventy-two hours before lights out and ends only when you have reviewed the result against your model.
Pre-Race Data Analysis: Practice, Qualifying and Long Runs
I lost money on the 2022 Hungarian Grand Prix because I ignored FP2 long-run data. My pre-race model had Max Verstappen as a clear favourite based on qualifying simulations, but the long runs told a different story — Mercedes had stronger degradation profiles on the medium compound. George Russell won that race. The long-run data was screaming it, and I did not listen.
That experience rewired how I approach a race weekend. Every session now feeds a different layer of the analysis, and each layer has a specific job.
Friday practice: the raw material
FP1 is largely exploratory. Teams run aero rakes, test setup directions and give reserve drivers seat time. The lap times are close to meaningless for betting purposes. What matters is the order in which teams explore compounds — if a front-running team goes straight to the soft tyre in FP1, they are probably chasing a setup baseline rather than sandbagging, and their FP2 data will be more representative.
FP2 is where the real work happens. The session splits into two phases: short runs on low fuel to simulate qualifying, and long runs on high fuel to simulate race pace. I record every timed sector from both phases into a spreadsheet, filtering out in-laps, out-laps and any lap with a yellow flag sector. The result is a clean picture of where each car sits in raw pace and, crucially, how quickly their tyres degrade over a stint.
A long run is typically six to twelve consecutive laps on the same compound. What I am looking for is the slope of the lap time curve. A driver whose lap times increase by 0.05 seconds per lap on mediums has a fundamentally different race profile from one losing 0.12 seconds per lap. That 0.07-second difference per lap compounds over a twenty-lap stint into a gap of 1.4 seconds — enough to change a pit strategy window entirely.
F1’s partnership with ALT Sports Data as its Official Betting Data Supplier has started to push real-time predictive analytics into the market, but the raw timing data from practice sessions remains freely available through the FIA’s timing screens and various fan-built telemetry tools. The edge is not in accessing the data. It is in knowing which numbers matter and which are noise.
Saturday qualifying: pace confirmation
Qualifying strips away the variables. Same compound for everyone in Q3, low fuel, maximum attack. The gaps here tell you about the car’s one-lap potential, which is different from race pace but still valuable. I pay closest attention to three things: the delta between a driver’s best Q3 lap and the theoretical best (best sector one plus best sector two plus best sector three), the consistency across Q2 and Q3, and the gap to their teammate.
The teammate gap is diagnostic. If one driver is consistently two tenths off their teammate across qualifying sessions, that tells me something about their comfort level with the setup or the track conditions. Head-to-head betting markets are priced partly on historical qualifying deltas, so finding weekends where that gap is abnormally large or small can flag a mispricing.
Putting it together: the pre-race model
By Saturday evening, I have three data layers: FP2 race-pace estimates, qualifying performance, and tyre degradation rates per compound. I combine these into a simple model that estimates finishing positions based on starting grid, likely pit strategy and expected pace over each stint. It is not a sophisticated algorithm — it is a spreadsheet with conditional logic — but it gives me a probability distribution for each driver finishing in the top three, top six and top ten. That distribution is what I compare against the bookmaker’s odds to find value bets where implied probability diverges from my estimates — a process that becomes especially powerful when you layer in tyre strategy and degradation data.
The key discipline is updating the model after every session rather than anchoring to pre-weekend expectations. If your favourite looked strong in testing but is half a second off in FP2, the model does not care about testing. It cares about FP2.
Identifying Value: Implied Probability vs Your Model
Every price a bookmaker offers contains a hidden number: the implied probability that outcome will happen. If you cannot calculate that number, you cannot know whether a bet is overpriced or underpriced. And if you do not know that, you are just guessing with extra steps. Converting between odds formats and extracting implied probability is a skill that underpins everything else in this guide, and I will walk through it here.
What I want to focus on here is the comparison — how to take the probability your pre-race model spits out and measure it against the market price to determine whether a bet has positive expected value.
The comparison process
Suppose your model estimates that a particular driver has a 28% chance of finishing on the podium. The bookmaker is offering odds that imply a 20% probability. The gap between your estimate and the market’s is eight percentage points. That is a meaningful edge — if your model is even roughly calibrated.
I use a threshold of five percentage points. If my model and the bookmaker agree within five points, I treat the price as fair and move on. If the gap is wider than five points in my favour, the bet goes on the shortlist. If the gap is wider than five points against me — my model says 15% but the market says 25% — I ask myself what I am missing rather than assuming the market is wrong.
This is the hardest discipline in value identification: respecting that the market is not stupid. Bookmakers employ traders who watch every session, and F1 markets have sharpened considerably since 2024. When my model disagrees with the market by a large margin, the correct first response is to check my inputs rather than reach for my wallet.
Where the edge actually lives
In nine years of doing this, I have found that the most consistent edges come from two places. First, long-run data that the market has not fully digested by the time qualifying ends. Many casual bettors and even some sharp ones update their view based on qualifying positions alone, because grid position is the most visible data point. But qualifying pace and race pace are different measurements. A car that qualifies sixth with the best long-run degradation profile in the field is often underpriced for a podium finish, because the market overweights Saturday’s grid order.
Second, specific circuit characteristics that amplify or dampen overtaking difficulty. At a track like Monaco, qualifying position is almost everything, and the market prices that in tightly. But at circuits with long straights and DRS zones — Spa, Monza, Bahrain — a car starting lower on the grid but carrying superior race pace can carve through the field. The market tends to be less efficient at pricing position changes at high-overtaking circuits, which creates value in podium and top-six markets for drivers who qualified below their true race pace.
Calibration over time
None of this works if you build a model and never test it. After every race, I record what my model predicted versus what actually happened. Over a season, this generates a calibration curve: if my model says “25% podium probability” for a given set of conditions, does the driver actually finish on the podium roughly 25% of the time across similar predictions? If my 25% predictions hit 35% of the time, my model is underestimating something — probably race pace relative to grid position. If they hit 12%, I am overestimating it.
This feedback loop is what separates a strategy from a hunch. A hunch stays the same regardless of outcomes. A strategy evolves with data.
Race-Day Variables: Weather, Safety Cars and Grid Penalties
Your model is built. Your value bets are shortlisted. Then the formation lap starts under grey skies, and everything you calculated on Saturday night becomes a suggestion rather than a forecast. Race-day variables are the reason F1 betting is harder than football or tennis — and also the reason it rewards preparation more generously.
A third of F1 fans under 35 say they are more likely to watch a race if they have a pre-race or live bet riding on it. That emotional investment is exactly what makes race-day variables so dangerous for undisciplined bettors. When a safety car bunches the field and your pre-race favourite drops from a comfortable lead to a restart in traffic, the temptation to panic-bet or chase a hedge is enormous. Having a plan for these scenarios before the lights go out is not optional — it is the difference between a strategy and a gamble.
Weather
Rain is the single biggest variance amplifier in F1. A dry race at a power circuit like Monza will usually produce a finishing order close to the qualifying order, because the car performance hierarchy holds. A wet race at the same track can produce a podium nobody predicted, because driver skill in changing conditions, team strategy on tyre calls and sheer luck play outsized roles.
My approach to weather is binary. If the forecast shows a high probability of rain during the race — above 60% from multiple weather services — I reduce my stake size by half across all pre-race bets and reserve the other half for in-play opportunities once conditions become clear. If the forecast is dry, I proceed with standard sizing. The middle ground — 30% to 60% rain probability — is where most punters get hurt, because they bet as if it is dry and then scramble when conditions change. I treat that middle ground the same as a high-rain scenario: smaller pre-race stakes, capital reserved for live markets.
Safety cars
The average F1 season produces safety car deployments in roughly 40% to 50% of races, depending on circuit characteristics. Street circuits like Monaco, Jeddah and Singapore have historically higher safety car rates because the barriers are closer to the track and recovery is slower. Purpose-built circuits with large run-off areas — Bahrain, Paul Ricard — see fewer deployments.
A safety car erases time gaps. A driver leading by twelve seconds suddenly has the entire field on their gearbox at the restart. For live bettors, this is either a disaster or an opportunity depending on position. If you hold a pre-race bet on the leader, a safety car is pure downside risk. If you hold a bet on a driver running fourth with strong race pace, a safety car is a gift — it compresses the field and gives them a chance to attack the podium on the restart.
I factor safety car probability into my pre-race model as a modifier. At high-SC circuits, I discount the value of large grid-position advantages and increase the value of strong restart pace. At low-SC circuits, I trust the qualifying order more heavily.
Grid penalties
Engine and gearbox penalties are announced before qualifying but sometimes after practice sessions. A five-place or ten-place grid drop changes the entire market dynamic for that driver and, by extension, for every driver around them. The market usually adjusts quickly for the penalised driver, but it is slower to adjust for the drivers who benefit from the grid shuffle — that is where I look for value.
If a top-three qualifier takes a ten-place penalty, the drivers who were qualifying fourth through seventh suddenly have a better shot at the podium. Their odds should shorten, and they usually do — but not always by enough, especially if the penalty is confirmed late on Saturday. Speed matters here: the window between penalty confirmation and market adjustment is where some of the cleanest edges of the season live.
Bankroll Management for F1 Bettors
63% of motorsport bettors wager between one and one hundred pounds per month. That is a perfectly sensible range, and I wish more betting guides acknowledged it instead of assuming everyone has a thousand-pound bankroll. The principles of bankroll management work identically whether you are staking five pounds per race or five hundred. The percentage stays the same even when the numbers change.
My rule is straightforward: never risk more than 3% of your total betting bankroll on a single F1 bet. If your bankroll is 200 pounds, that means a maximum of 6 pounds per bet. If it is 2,000 pounds, the cap is 60 pounds. This sounds conservative, and it is — deliberately so. F1 has twenty-four races per season, most with multiple betting markets. If you are placing three to five bets per race weekend, that is seventy to one hundred and twenty bets per year. Variance over that sample size can be brutal if your unit size is too large.
The 3% rule has a specific mathematical justification: it limits the probability of a catastrophic drawdown. Even a model with a genuine 8% edge will experience losing streaks of ten or more bets during a season. At 3% per bet, a ten-bet losing streak costs 30% of your bankroll — painful but recoverable. At 10% per bet, the same losing streak wipes out your entire bankroll. The difference between surviving a bad run and going bust is not skill. It is sizing.
Staking tiers
Not every bet carries the same conviction level. I use three tiers. A standard bet — where my model shows an edge of five to eight percentage points — gets 2% of bankroll. A strong bet — edge above eight points with corroborating data from multiple sessions — gets 3%. And a speculative bet — an interesting mispricing I cannot fully explain — gets 1%. Most weekends produce one or two standard bets, occasionally a strong bet, and one speculative punt if the market throws up something unusual.
The discipline is in the tier assignment, not the bet itself. It is easy to talk yourself into upgrading a standard bet to a strong bet because you “feel good” about a driver’s weekend. I keep a written log of why each bet was assigned its tier, and I review those notes after the race. If I find I am consistently upgrading tiers on instinct rather than data, I know my process is drifting.
Season-long thinking
F1 betting rewards patience more than most sports because the calendar is spread across ten months. A bad weekend at Bahrain in March does not need to be recovered by Jeddah two weeks later. The sample size grows steadily, and a disciplined process will produce results over a full season even if individual weekends go against you. The bettors who blow up their bankroll are almost always the ones trying to recover losses within a single race weekend rather than trusting the long-term edge.
Three Strategy Mistakes and How to Fix Them
I have made every mistake on this list, most of them more than once. The value of experience is not avoiding errors entirely — it is recognising the pattern faster each time and cutting the damage before it compounds.
Anchoring to pre-season narratives
Every February, the F1 media machine produces a hierarchy of expectations based on testing and off-season analysis. By the third race, that hierarchy is usually wrong in at least one significant way — a team that was supposed to dominate is struggling, or a midfield outfit has found unexpected pace. The mistake is continuing to bet based on the pre-season story rather than updating your model with live data.
The fix is mechanical: after every race, recalculate your base performance estimates from scratch using the last three races of data. Do not blend in pre-season expectations. If Williams is outperforming your model for three consecutive weekends, your model is wrong about Williams, not Williams being lucky. Adjust.
Treating every race as independent
F1 races are not independent events. The same cars, drivers and engineers carry performance trends from one weekend to the next. A team that introduces a major upgrade at one circuit will carry that upgrade — and its performance implications — to every subsequent race. Treating each weekend as a fresh slate means ignoring the single most predictive feature in your dataset: recent form weighted by circuit type.
The fix is to classify circuits into categories — high-downforce, low-downforce, street, power — and track team performance within each category. A car that excels at low-downforce tracks like Monza and Spa is likely to perform well at Baku’s long straights too, even if it struggled at high-downforce Monaco the week before. Cross-referencing circuit type with recent performance is a better predictor than raw championship position.
Ignoring the tyre cliff
The tyre cliff — the sudden, dramatic loss of grip when a tyre’s rubber compound has degraded past its operating window — is the most underpriced variable in F1 betting. A driver leading a race by four seconds can lose that advantage in two laps if they hit the cliff before their pit window opens. The market prices in gradual degradation but consistently underprices the probability of a cliff event, especially on circuits with high-energy corners that punish rear tyres.
The fix is to study degradation curves from practice long runs and identify which teams show a linear decline versus an exponential one. Linear degradation is manageable and predictable. Exponential degradation — slow, slow, slow, then sudden collapse — is a race-changing event that creates live betting opportunities. If you can identify which cars are running close to their tyre cliff threshold before the race starts, you have an informational edge that most of the market lacks.
