
 Available in US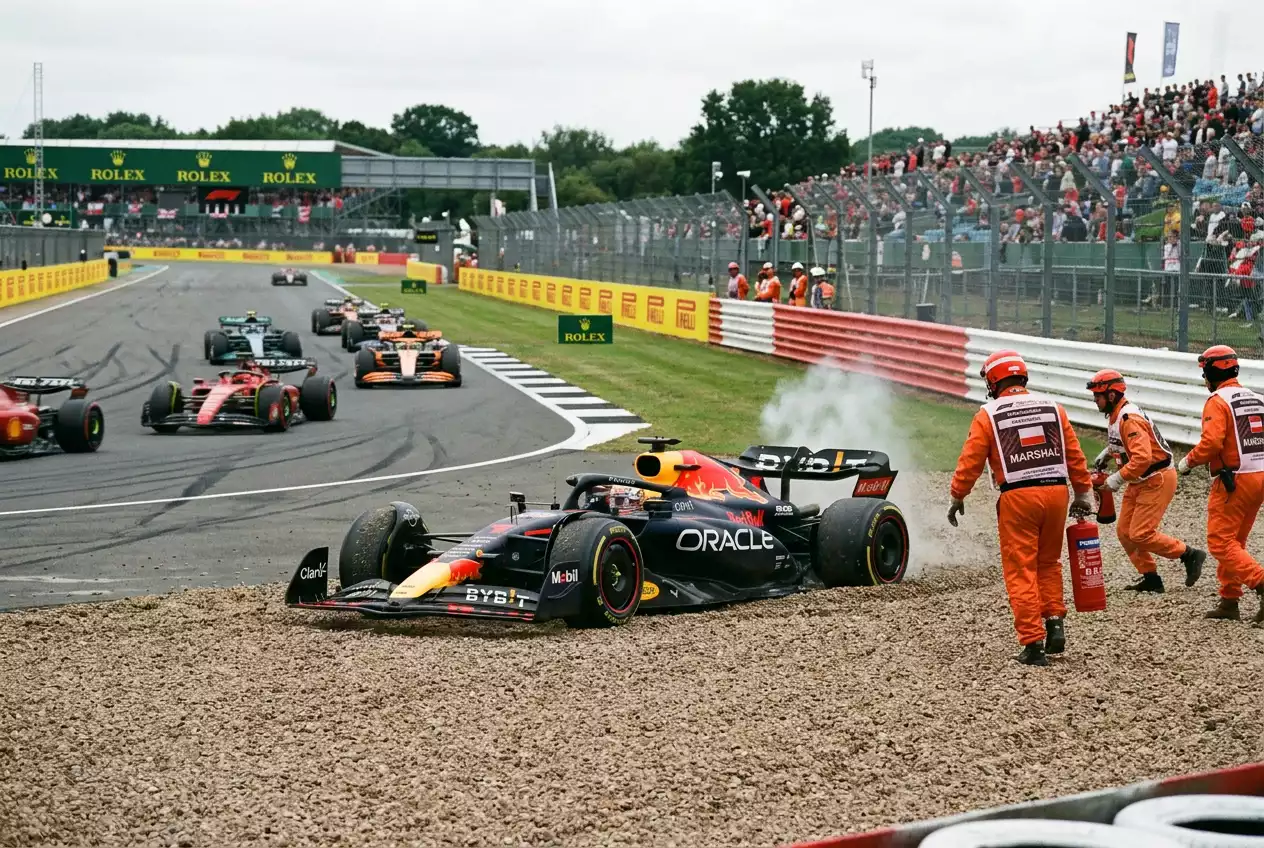
The Market That Pays When Things Go Wrong
Bahrain 2024, lap twenty-two. I was watching a driver cruise in fourth place — comfortable, consistent, collecting solid points. Then a puff of smoke from the rear of the car, a sharp deceleration, and the onboard camera showed him pulling off the circuit with a terminal engine failure. My pre-race “total retirements over 2.5” bet was suddenly alive. Two more mechanical failures later in the race, and it paid. That is the peculiar appeal of DNF betting: you profit not from picking winners, but from understanding the probability that the grid will thin before the chequered flag.
Retirement markets — also called DNF (Did Not Finish) markets — ask how many drivers will fail to complete the race, or whether a specific driver will retire. These markets operate on the margins of F1 betting, attracting far less volume than race winner or podium markets. The low volume means less sharp money, less efficient pricing and more persistent edges for bettors who track the right variables. F1’s global fan base of 827 million follows the spectacle of victory; the retirement market rewards those who study the machinery of failure.
What Causes F1 Retirements and How Predictable Are They
Retirements fall into three broad categories, each with different predictive signals. Mechanical failures — engine, gearbox, hydraulics, electronics — account for roughly forty to fifty per cent of all retirements in a typical season. These are partially predictable: teams approaching their component allocation limits are running older, higher-mileage parts that carry elevated failure risk. A team on their fourth engine while the allocation allows only three is racing borrowed time.
Collision-related retirements make up another thirty to forty per cent. These are harder to predict individually but follow statistical patterns at the circuit level. Street circuits and circuits with tight first corners produce more first-lap incidents. Wet races produce more mid-race collisions. Circuits with high-speed sections adjacent to barriers — Jeddah, Baku, Spa — produce more dramatic impacts that end races rather than merely damaging cars.
The remainder comes from driver errors, strategy failures (running out of fuel, being lapped and pulled in by the team) and regulatory disqualifications. These are largely unpredictable on a per-race basis but contribute to the overall retirement rate that forms the baseline for total-retirements markets.
The average retirement rate across a modern F1 season runs between two and four drivers per race. That baseline shifts significantly between circuits. A street race at Singapore might average 3.5 retirements per race historically, while a standard dry race at Barcelona averages closer to 1.5. The total-retirements market is typically set at 2.5 or 3.5, and knowing the circuit-specific average tells you immediately which side of that line carries value.
Reliability Tracking: The Bettor’s Maintenance Log
Every F1 power unit component has a lifespan measured in racing kilometres. The FIA tracks each driver’s component usage and publishes it — how many engines, turbos, energy stores and control electronics each driver has used relative to their seasonal allocation. This information is public, free and updated after every race weekend.
I maintain a simple spreadsheet that logs each driver’s component usage alongside the estimated mileage on each part. When a driver enters a race weekend with their third engine at 4,500 kilometres while the expected lifespan is 5,000 kilometres, the probability of a mechanical retirement ticks upward. It is not certain — components can exceed their rated lifespan — but the tail risk is real, and the market rarely prices it granularly enough.
The signal becomes strongest in the final third of the season. By race sixteen or seventeen, several drivers are typically on high-mileage components with no penalty-free replacements available. They face a choice: run the worn parts and risk failure, or take a grid penalty to install fresh components. Teams that choose to run the risk are providing you with a direct signal that mechanical retirement probability is elevated. Thirty-three per cent of fans under thirty-five are more likely to watch when they have a bet riding on the outcome — and a “specific driver to retire” bet at 8/1 or 10/1, informed by component mileage data, turns those final-stint laps into gripping viewing.
Circuit-Specific DNF Patterns
The retirement rate is not uniform across the calendar, and the type of retirement varies by circuit in ways that matter for different market types.
High-speed circuits with barrier-adjacent run-off — Jeddah, Baku, Spa — produce retirements from high-energy impacts. A crash at 250 kilometres per hour that would be a gravel-trap excursion at Barcelona becomes a race-ending barrier impact at Jeddah. The total-retirements market at these circuits should be priced higher than the season average, and if the bookmaker uses a generic 2.5 line, the “over” carries value.
Street circuits with tight corners and limited visibility — Monaco, Singapore, Melbourne — produce retirements from first-lap incidents and mid-race barrier strikes caused by driver fatigue or concentration lapses. The retirement rate is elevated, but the cause is different from high-speed circuits. At street circuits, the “total retirements” market and the “safety car yes” market are correlated — a retirement often triggers a safety car, and a safety car period can lead to further incidents at the restart. Combining both in a bet builder exploits this correlation.
Thermal-stress circuits — Bahrain, Qatar, Singapore — push the power unit cooling systems to their limits. Engine-related retirements are more common at these venues because the ambient temperatures and low-speed sections reduce airflow through the radiators. A team that has been managing borderline cooling issues all season is most likely to suffer a terminal failure at a hot circuit in the second half of the year, when component mileage is already high.
Betting the Specific Driver Retirement Market
The specific-driver retirement market prices each driver individually to retire from the race. Odds typically range from 4/1 to 12/1 depending on the driver’s reliability record, team, and circuit. The market is inefficient because it attracts minimal sharp-money attention — most bettors are focused on who will win, not who will fail to finish.
My targeting criteria for this market: identify drivers on high-mileage power unit components approaching a thermal-stress or high-speed circuit, then check whether their team has shown any reliability patterns earlier in the season. If the team has already suffered two mechanical retirements and the driver is running components past their expected lifespan, the retirement odds should be shorter than the market offers. A 10/1 price on a driver whose mechanical retirement probability is closer to fifteen per cent (fair odds around 5.5/1) is a significant overlay.
One structural note: “retirement” in betting terms usually means the driver fails to see the chequered flag, regardless of whether they are classified. A driver who retires on the final lap after completing ninety per cent of the race distance may still be classified in the results but counts as a retirement for betting purposes. Conversely, a driver who is disqualified post-race is typically not settled as a retirement — they finished the race but were excluded from the results afterward. Always read the specific settlement terms, as these edge cases create disputes every season.
