
 Available in US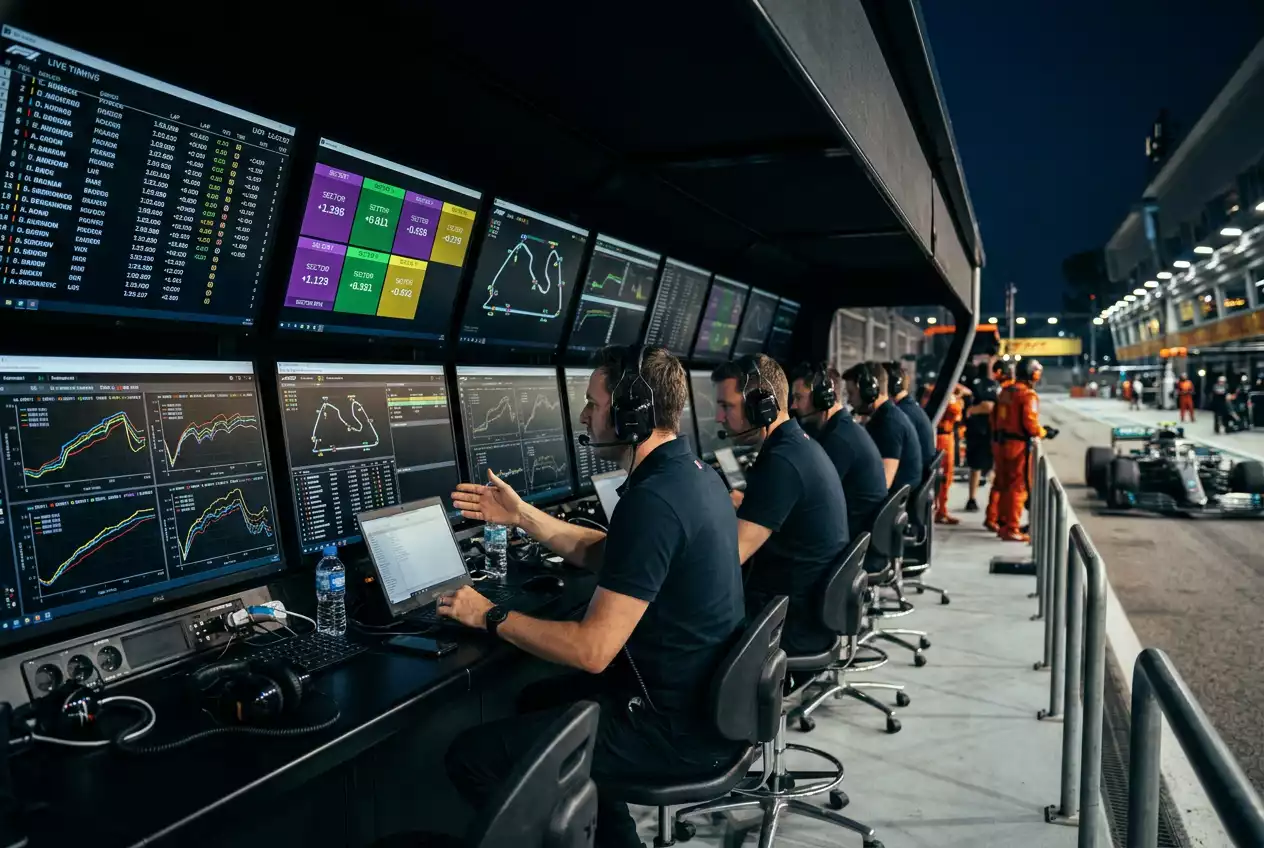
From Gut Feeling to Data Model
My worst betting year was 2018. I was making picks based on broadcast commentary, social media consensus and vague feelings about which driver “looked quick.” I finished the season down seventeen per cent on my bankroll. The following year, I started pulling timing data from practice sessions and building simple spreadsheets. I finished up nine per cent. The only thing that changed was the information I used.
F1 generates an extraordinary volume of data across a race weekend — sector times, speed trap readings, tyre degradation curves, gap histories, pit-stop durations, DRS activation zones and more. F1’s appointment of ALT Sports Data as Official Betting Data Supplier in 2025 was built on exactly this premise: the sport produces high-volume, low-latency data at a scale that makes sophisticated real-time analytics possible. For individual bettors, the question is not whether data helps — it obviously does — but which data points carry the most predictive weight and where to find them.
How to Read F1 Timing Sheets for Betting
The FIA publishes official timing sheets after every session — FP1, FP2, FP3, qualifying and the race. These are freely available on the FIA’s document portal. Most bettors never look at them, which is precisely why they are valuable.
A timing sheet lists every driver’s best lap time, sector times, speed trap readings and the number of laps completed. The headline number — best lap time — is the least useful for betting purposes. It tells you who was fastest, but not why. A driver who sets the best time on low fuel with fresh soft tyres in qualifying trim is not necessarily the best bet for the race, where the conditions are entirely different.
What matters more is consistency across a stint. Look at a driver’s lap times over a sequence of laps on the same compound — say, their first ten laps on hard tyres. If those times cluster tightly, with degradation of less than a tenth per lap, the driver is managing their tyres well and their race pace is genuine. If the times scatter or show sharp degradation after five laps, the driver may qualify well but struggle in the race.
The speed trap column tells a parallel story. A driver who is quick through the speed trap but slow in the overall sector time is carrying a low-downforce setup — fast on the straights, slow in the corners. That setup choice tells you something about their strategy for the race: they are likely expecting to use DRS heavily and may be planning an aggressive overtaking approach. Conversely, a driver with a high-downforce setup (slower speed trap, quicker sector time) is likely prioritising tyre management and race pace over qualifying position.
Sector-by-Sector Pace and What It Reveals
F1 divides every circuit into three sectors. Sector times break down a driver’s performance into the track’s distinct phases — typically a mix of straights, high-speed corners and low-speed technical sections. For betting, sector analysis reveals where a driver’s advantage lies and whether it will translate from Saturday to Sunday.
Here is a practical example. At Monza, Sector 1 and Sector 3 are dominated by long straights, while Sector 2 contains the Lesmo corners and the Ascari chicane. A driver who is fastest in Sector 2 but loses time in Sectors 1 and 3 has a car with strong mechanical grip but less straight-line speed. In the race, that driver will be vulnerable to DRS-assisted overtakes on the main straight but resilient through traffic in the twisting sections. For a head-to-head bet, that information is gold: pair them against a rival who excels in the speed-trap sectors, and you can predict how the battle will unfold.
Sector analysis also exposes track evolution. As rubber is laid down over a weekend, the track surface improves, and sector times drop. If a driver set their best time on Friday afternoon but has not improved proportionally by Saturday morning, they may have peaked early — their setup was optimised for a “green” track and is losing relative performance as conditions evolve. This is a subtle signal that the pre-race favourite might be more vulnerable than the headline times suggest.
F1 accounts for just 0.4 per cent of the global betting handle despite its 827-million-strong fan base. One reason the handle is so low relative to the audience is that casual bettors find F1 data overwhelming. But sector times are not complex — they are three numbers per lap, per driver. Once you learn to read them in context, they become the simplest and most powerful tool in your analytical kit.
Qualifying Pace vs Race Pace: A Bettor’s Distinction
This is the single most important analytical distinction in F1 betting, and I am constantly surprised by how many experienced punters ignore it.
Qualifying pace is a driver’s speed over a single lap on minimal fuel with fresh soft tyres. Race pace is their speed over a full stint on heavier fuel with degrading tyres. The two are correlated — a fast car in qualifying is usually a fast car in the race — but the correlation is imperfect, and the gap varies enormously between drivers and teams.
Some teams build cars that extract maximum performance from the soft tyre on a single lap but suffer higher degradation over a stint. These “qualifying flatterers” look dominant on Saturday and disappoint on Sunday. Other teams build for Sunday: their cars are less spectacular in qualifying but come alive in the race, maintaining pace as the tyres wear. If you bet on the qualifying results without adjusting for this distinction, you are systematically overvaluing Saturday specialists and undervaluing Sunday specialists.
The data to distinguish them is in the long-run times from practice. FP2 on Friday is traditionally the session where teams run race simulations — sequences of fifteen to twenty laps on heavier fuel. Compare the average long-run pace between two drivers on the same compound, and you get a direct read on their relative race speed. If Driver A is two tenths faster than Driver B over a single qualifying lap but only one tenth faster (or even slower) over a race simulation, the head-to-head and podium markets should reflect that — and they often do not.
One caveat: long-run data from practice is not perfectly representative. Teams sometimes sandbag practice runs, or run with experimental setups that will not appear in the race. The signal is noisy. But across a sequence of races, the long-run delta between teammates or close rivals is remarkably stable and provides a stronger betting signal than qualifying results alone. Build a simple tracking spreadsheet — qualifying gap versus race-pace gap for each driver pairing at each circuit — and you will have an information edge that no amount of pundit commentary can replicate.
