
 Available in US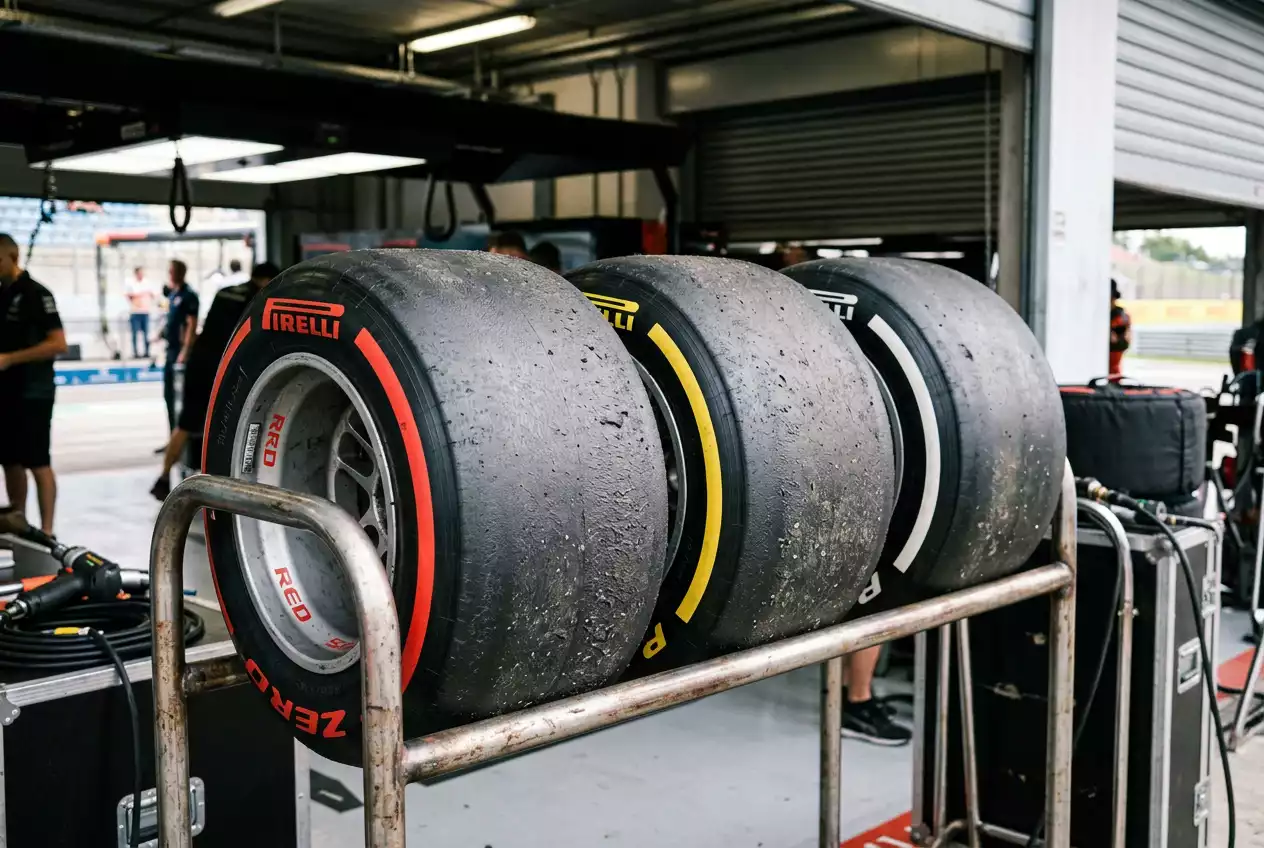
Why Tyre Strategy Is F1 Betting’s Hidden Variable
In Barcelona 2023, the pre-race favourite qualified on pole and led the first stint comfortably. By lap twenty, his tyres had fallen off a cliff. Two mid-grid drivers on a different compound strategy sailed past, and the favourite finished fifth. The race winner had been priced at 8/1. I had backed him at 7/1, purely because Friday’s long-run data showed his car was 0.3 seconds per lap kinder to the medium compound than anything else on the grid.
Tyre strategy is the variable that separates F1 from every other sport in the betting world. Football does not have a built-in mechanical degradation element. Tennis does not require mid-match equipment changes that alter competitive dynamics. In F1, every driver must manage a consumable resource that degrades with every lap, and the decisions teams make about which tyres to use, when to pit and how aggressively to push create swings in race outcomes that the pre-race odds rarely capture. F1’s partnership with ALT Sports Data as Official Betting Data Supplier exists in part because tyre and strategy data generates the kind of real-time predictive analytics that drive micro-market opportunities.
Tyre Compounds and Their Betting Implications
Pirelli supplies three dry-weather compounds to every race: soft (red), medium (yellow) and hard (white). The naming is consistent, but the actual rubber composition changes between circuits. The “hard” tyre at a low-abrasion track like Monza is softer than the “hard” at a high-degradation track like Silverstone. Pirelli publishes the compound allocation for each event in advance, and the step between compounds — the performance gap measured in lap time — varies from race to race.
From a betting perspective, the key number is the crossover point: the lap on which a newer, harder compound becomes faster than an older, softer compound despite the initial pace deficit. If the soft tyre is 0.8 seconds per lap faster than the hard but degrades at 0.15 seconds per lap more, the crossover arrives after about five laps on the harder rubber. That crossover point defines the pit window — the range of laps during which a pit stop is strategically optimal.
When the compound step is large (more than a second per lap), strategy flexibility increases. Teams can run the soft for a short opening stint, switch to the hard, and have vastly different strategic profiles from rivals who started on mediums. Large compound steps produce more varied strategies, more overtaking through pit-stop offsets, and more unpredictable outcomes. That is the kind of race where outsider bets and each-way positions thrive.
When the compound step is small (less than half a second), most teams converge on similar strategies, and the race tends to be decided by raw car pace and qualifying position. Small compound steps favour the pre-race favourite and reduce the value of tyre-based contrarian bets.
Reading Degradation Curves from Practice Data
A degradation curve plots a driver’s lap time across a stint, showing how much time they lose per lap as the tyres wear. The shape of this curve is the single most important piece of information for tyre strategy betting, and it is available for free in the practice session data.
A linear degradation curve — lap times getting steadily slower by a consistent amount — indicates predictable tyre behaviour. The team can plan their strategy with confidence, and the race is unlikely to produce tyre-related surprises. A convex curve — degradation accelerating in the later laps of a stint — signals a “tyre cliff,” where performance drops suddenly rather than gradually. Teams approaching the cliff face a dilemma: pit early and lose track position, or stay out and risk catastrophic pace loss. Tyre cliffs are where races are won and lost, and they are where bettors find the widest mispricings.
Thirty-three per cent of F1 fans under thirty-five say they are more likely to watch a race when they have money on the outcome. The drama they are watching often comes down to exactly these tyre dynamics — a leader nursing degrading rubber while a pursuer on fresh tyres closes at a second a lap. If you have read the degradation curves from Friday practice, you can anticipate that drama before it happens and position your bets accordingly.
To read degradation from practice data: pull the lap times from a driver’s longest stint on each compound in FP2. Ignore the first two laps (out-lap and warm-up) and the last lap (often a cool-down). Plot the remaining laps and calculate the average time loss per lap. Compare this number across drivers on the same compound. The driver with the lowest degradation rate has a strategic advantage: they can run longer stints, pit later, and carry tyre performance deeper into the race. That driver is often underpriced in race winner and podium markets because their qualifying position may not reflect their Sunday strength.
Pit Window Calculations and Their Market Impact
The pit window is the range of laps during which a driver is likely to make a pit stop. It is determined by the degradation rate, the compound step and the time lost in the pit lane (typically twenty to twenty-five seconds, depending on pit-lane length and speed limit).
Here is a simplified calculation. If a driver on soft tyres is degrading at 0.12 seconds per lap faster than a driver on hard tyres, the soft-tyre driver needs to pit before the cumulative time loss exceeds the pit-lane time cost. At 0.12 seconds per lap, that is roughly twenty seconds divided by 0.12 = approximately 167 laps, which is obviously more than any stint. But the degradation is rarely linear — it accelerates. With a more realistic accelerating degradation model, the pit window might open at lap fifteen and close by lap twenty-two. That seven-lap window is where the race pivots.
For betting, the pit window tells you when odds will shift most dramatically in live markets. As drivers approach their pit window, the market prices in the probability of an imminent stop. A driver who extends their stint beyond the expected window signals one of two things: either their tyre degradation is lower than expected (bullish for their race outcome) or their team is gambling on a late safety car to get a free pit stop (higher risk, higher reward). Both scenarios produce sharp odds movements that informed bettors can exploit.
Teams also use the pit window offensively. The “undercut” — pitting a lap or two before your rival to gain time on fresh tyres while they are still on worn rubber — depends entirely on the pit window calculation. If the undercut advantage is large enough to overcome the pit-lane time loss, the team that pits first gains track position. Watching for the undercut in real time is one of the most reliable live-betting signals in F1: when a trailing driver pits unexpectedly early and the gap to the leader closes on the subsequent lap, the leader’s live odds should drop — and they do, but often with a delay that gives you a window to act.
I keep a simple race-day worksheet with three columns: expected pit window for each driver (based on Friday data), actual pit-stop lap, and whether the stop was early, on time or late relative to the model. Over a season, tracking this across every race builds an intuition for strategic behaviour that no amount of broadcast commentary can match. The numbers do the talking, and the market follows the numbers — usually a few laps late.
